Most people don’t spend much time thinking about the infrastructure that keeps industries running.
Whether it’s offshore platforms, wind farms, industrial facilities and critical assets, all are constantly exposed to harsh environment, corrosion and ageing over time.
But the question is: When an inspection is completed, what you do with the data afterwards?
Stage one: Before Inspection Comes Preparation
How do you inspect infrastructure that is difficult, dangerous or even impossible for people to access safety? The answers start long before any data is collected. Every project begins with carefully detailed planning and mobilisation of equipment and personnel. Every offshore asset is unique, meaning no two inspection campaigns for caissons, conductors or J-tubes are ever the same.
Stage two: Getting Eyes on the Asset
You can’t manage what you can’t see. Many critical assets sit in challenging environments where traditional inspection methods can be costly, time consuming or present additional safety risks.
Using remotely operated inspection systems, we can access confined spaces, internal structures and difficult-to-reach.
High-definition visual inspection provides the first layer of asset understanding. Finding a defect is only the beginning, what is happening beneath the surface is far more important.
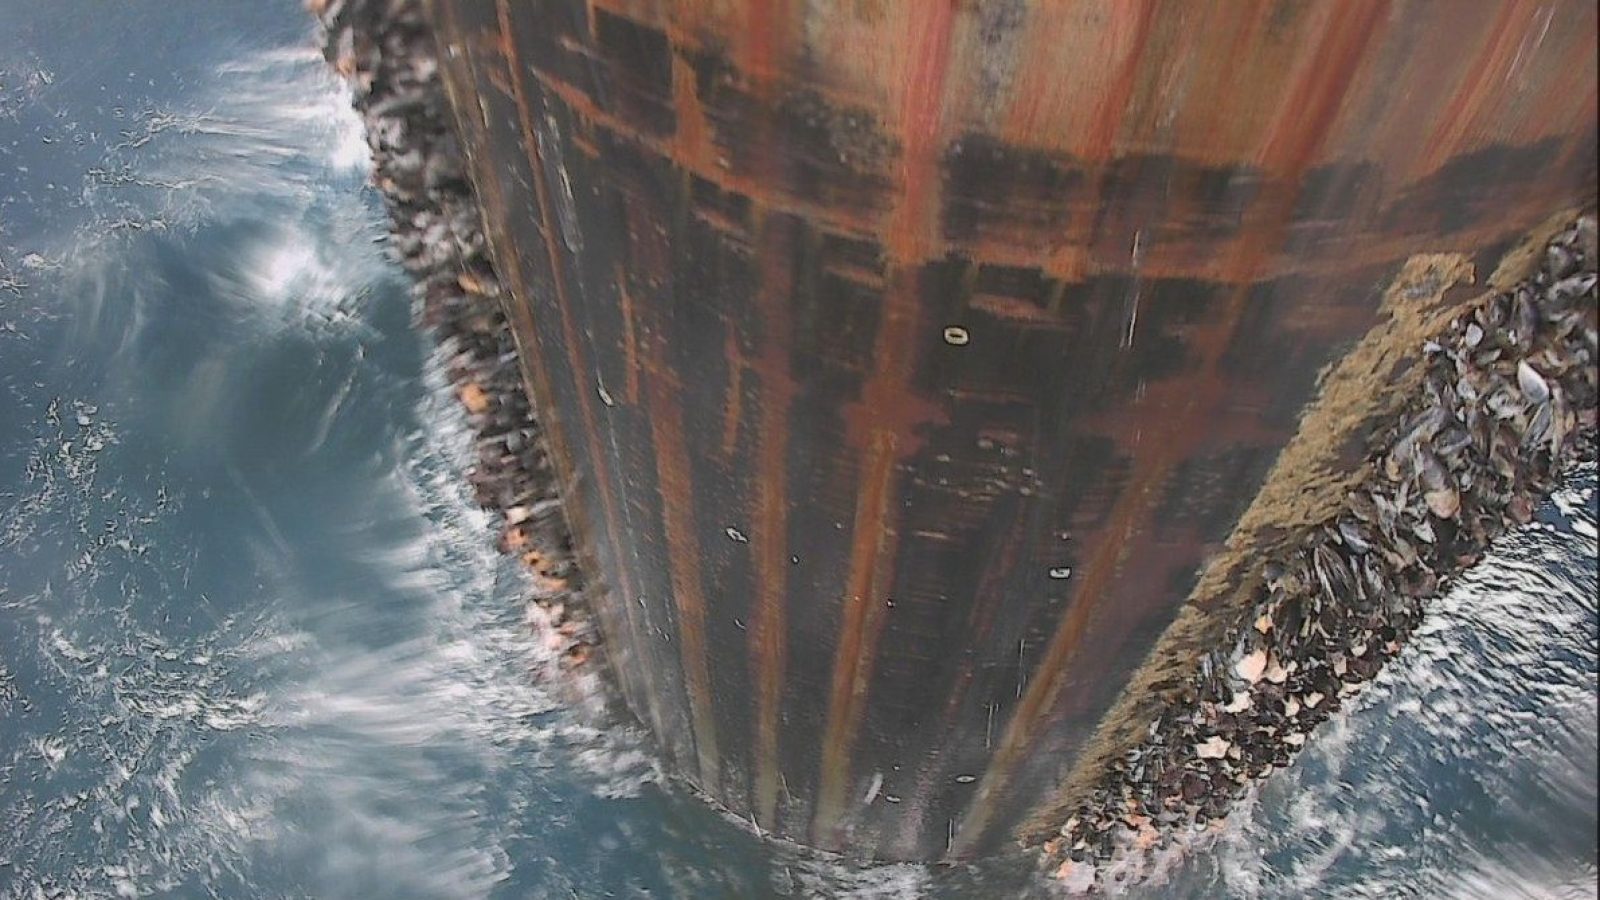
Stage three: Why Cleaning Matters More Than People Think
Imagine taking a scan through a dirty window – that’s what inspectors face when marine growth and debris cover an asset’s surface.
Before detailed inspections, high-pressure jetting is used to expose the true condition of the structure, very critical to ensure inspection data is accurate and reliable. After all, the quality of any decision depends on the quality of information behind it.
Stage four: Looking Beyond what the Eye Can See
Just because a structure looks healthy doesn’t mean it is. Once surfaces are prepared, advanced NDT techniques help inspectors understand what’s happening inside the asset.
Technologies such as ultrasonic testing, pulsed eddy current and phased array, measure wall thickness, identify corrosion and detect defects long before they are visible.
This allows operators to move away from reactive maintenance and towards informed decision-making evidence rather than assumptions.
At this stage, huge amounts of valuable data have been collected, which leads to another important question: what do we do with all this data?
Stage five: Turning Data Into Decisions
For years, inspection reports have lived in folders, spreadsheets, PDFS and databases spread across multiple departments. Connecting all the information together wasn’t easy.
That’s why we developed our cloud-based data management platform, bringing inspection data, imagery, videos, and historical records into a single platform.
Instead of viewing inspections isolated in a single snapshot, operators can begin seeing the bigger picture.
Patterns emerge. Trends develop. Risks become clear. And decisions become more informed.
But what if inspection data could do more?...
What If You Could Predict Future Asset Condition?
Traditionally, inspections tell us where an asset is today. Increasingly, operators want to know where it will be tomorrow.
This is where Project cAIsson changes the conversation.
Built using years of inspection data and asset integrity expertise, Project cAIsson uses artificial intelligence to identify trends, forecast degradation and support more proactive maintenance strategies.
Rather than asking “Has corrosion occurred?” Operators can start asking: “How fast is it developing?” “What could it look like in five years’ time?” and “Where should investment be prioritised?”
The industry has become very good at collecting data. The next step is learning how to use that data more intelligently.
Bringing It All Together
Inspection isn’t a single activity. It’s a journey.
From mobilisation and deployment through to cleaning, advanced NDT, digital asset management and AI-driven forecasting, every stage plays a role in building a clearer picture of asset health.
Our inspection process isn’t just collecting data. It’s connecting it, understanding it, and helping clients make smarter decisions with it.